Mediterranean Storms 2026 — Climate Attribution, What We Know, and What It Means
JOURNALIST BACKGROUNDER

Based on: Barnes et al. (2026), World Weather Attribution Scientific Report No. 83
https://spiral.imperial.ac.uk/server/api/core/bitstreams/138d17b7-9a61-42ec-887b-9c7ad5ef6ad1/content
Prepared for quality media and public broadcasting by @tom-weiss.bsky.social for editorial use and discussion.
Initial analysis of study: NotebookLM. This Backgrounder: Claude. Following Fact-Check: ChatGPT
1. What Happened: The Events in Plain Numbers
Between 16 January and 17 February 2026, nine named storms struck the Mediterranean in rapid succession, hammering Spain, Portugal, and Morocco. This is not normal. The previous seasonal record stood at 17 named storms for an entire winter season; the 2025–2026 season is on track to break it. These were not nine minor weather events. They arrived one after another, leaving soils saturated before each subsequent storm, compounding flood risk with each passing week.
The numbers are stark. In Grazalema, southern Spain, 581 mm of rain fell in a single 24-hour period on 5 February — and cumulative rainfall from January 1 to February 9 reached 2,527 mm, more than double the previous all-time record of approximately 1,000 mm set in 2009. January 2026 was Spain’s wettest January in 25 years, 185% above seasonal average. In Portugal, Storm Kristin produced winds of 202 km/h, surpassing the national record by nearly 30 km/h. One million people lost power or their homes in a single storm.
Morocco bore the worst humanitarian toll. 43 people died, 300,000 were displaced, and sites near Safi recorded almost a full month’s rainfall in three days. The Oued Makhazine dam exceeded capacity by 60%, triggering controlled releases that flooded agricultural land downstream. By mid-February, 110,000 hectares of farmland were inundated.
Total direct economic damage:
• Spain committed €7 billion in emergency aid, including €2 billion for municipal infrastructure and €1.78 billion from Andalusia alone.
• Portugal’s reconstruction costs exceed €4 billion, with agricultural and forestry losses alone estimated at over €775 million.
• Morocco allocated €280 million for restoration, with 700 small businesses damaged and transport infrastructure severely disrupted.
Bottom line for journalists: The scale of what occurred in early 2026 is not within the range of ordinary Mediterranean winters. The physical evidence of extreme rainfall, record wind speeds, and the sheer sequence of storms demands explanation, not normalization.
2. What the Attribution Study Can and Cannot Say
What it CAN say with confidence
The World Weather Attribution (WWA) study, authored by scientists from Imperial College London, KNMI, University of Alicante, and multiple partner institutions, applies a rigorous, peer-reviewed methodology: it compares the probability and intensity of extreme rainfall events in today’s climate against a modelled world 1.3°C cooler — approximating the pre-industrial baseline.
In the northern region (northwest Spain and northern Portugal), the findings are robust:
• Observed rainfall intensity on the wettest days has increased by approximately 29% since 1950.
• Combining observational data with climate models, the study attributes roughly 11% of this intensification directly to human-caused warming of 1.3°C.
• The probability of a comparable extreme rainfall event is estimated to be 3 to 7 times higher today than in a pre-industrial climate.
In the southern region (southern Spain and northern Morocco), the observational signal is even stronger:
• Observed Rx1day intensity has risen approximately 36% since 1950.
• Using ERA5 reanalysis data, the probability of the February 4 rainfall event is estimated at 48 to 65 times higher today than in a pre-industrial climate — though with very wide uncertainty bounds.
• The current negative phase of the North Atlantic Oscillation (NAO) contributed an additional 5% intensification on top of the climate change signal in the southern region.
The marine heatwave supplying moisture to the atmospheric rivers that fed these storms is also directly attributable to climate change. The study finds that heatwave conditions in the Atlantic source region are at least ten times more likely today than in a pre-industrial climate. Warmer ocean surfaces mean more evaporation, which means atmospheric rivers carry more water vapour and deliver heavier rainfall when they make landfall.
What it CANNOT say with the same confidence
The attribution of extreme rainfall in the Mediterranean involves genuine scientific uncertainty, and the study is transparent about this. Journalists should understand the distinction clearly.
The core tension: observations show a strong and accelerating intensification trend, particularly in the south. Climate models do not fully reproduce this trend. This discrepancy is not explained away — it is an honest scientific problem. Because of it, the study does not formally quantify a synthesised attribution number for the southern region. It states what the evidence points toward, not a precise probability ratio.
The study also does not attribute the frequency of storm sequences — that is, whether climate change caused nine storms in quick succession. The methodology examines changes in the intensity of the single wettest day in a season, not the occurrence of consecutive events. Attributing storm frequency to climate change requires additional research not yet available.
Wind attribution is not attempted at all, due to known limitations in how gridded observational datasets represent wind speeds. The record-breaking 202 km/h winds of Storm Kristin are documented, not attributed.
For journalists: “The science cannot say precisely how much worse this storm was because of climate change” is not the same as “climate change did not make this worse.” The distinction between uncertain quantification and uncertain existence of an effect is critical. The study finds consistent, multi-line evidence of intensification. The southern region numbers carry high uncertainty; the direction of effect does not.
3. What Established Science Already Knows
The WWA study did not emerge in a vacuum. It sits within a well-established body of literature. Journalists covering this story should understand what was already known before this study was published.
The Clausius-Clapeyron baseline
Basic atmospheric physics dictates that a warmer atmosphere holds more water vapour: approximately 7% more per degree of warming. This alone predicts heavier rainfall in events where moisture is the limiting factor. The Mediterranean storms of 2026 produced rainfall intensity increases exceeding this thermodynamic expectation in some locations — consistent with recent findings by Calvo-Sancho et al. (2026) and Barriopedro et al. (2025) showing that the heaviest Mediterranean rainfall events are intensifying faster than the Clausius-Clapeyron relationship alone would predict.
The IPCC baseline and what has changed since
The IPCC Sixth Assessment Report (AR6, 2021) assessed observed changes in extreme Mediterranean rainfall with low confidence — not because the physics was uncertain, but because observations and models diverged. The AR6 found that only at 4°C of global warming does a consistently increasing trend emerge with high confidence.
Studies published since AR6 have begun to close this gap. Research on Iberia-specific datasets finds increases in maximum precipitation in both Spain (Requena et al., 2023) and Portugal (Araujo et al., 2022). The rapid attribution study following Storm Daniel (Greece, Bulgaria, Turkey, 2023) also found clear intensification attributable to climate change in a similar Mediterranean context. The direction of scientific evidence has been consistent and is strengthening.
Attribution science as ‘the cherry on top’ — or something more?
Phrasing attribution science as “the cherry on top” of established knowledge is partly correct and partly misleading. Here is a more precise characterisation:
• What attribution science does NOT provide is the initial reason to act. The physical relationship between warming and extreme rainfall intensity is established basic science. Observed trends in extreme events are real and documented. Politicians and policymakers who require a formal attribution study before acting are setting a bar that the science was never designed to meet alone.
• What attribution science DOES provide is legally and politically significant specificity: it answers how much more likely or intense a particular event was because of human emissions. This has direct relevance for loss-and-damage frameworks, insurance liability, and the political accountability of fossil fuel producers and high-emitting governments.
• Attribution science also serves a crucial public communication function. Abstract warming projections do not move public opinion as effectively as a study saying that the floods which destroyed a family’s home were made 50 times more likely by climate change. This is not manipulation — it is translation of physics into tangible reality.
The cherry-on-top framing risks implying that the cake is already fully baked. It is not. Attribution science is adding new scientific understanding, not merely confirming what everyone already knew. In the Mediterranean context specifically — where IPCC confidence was low and model-observation discrepancies were substantial — each attribution study is doing real epistemic work.
4. Do We Need Attribution Studies to Act? The Honest Answer.
This is a question worth addressing directly, because it is posed frequently — by both those who want more action and those who want to delay it.
The scientific answer is: no, attribution studies are not a prerequisite for mitigation, adaptation, or loss-and-damage policy. The following are established facts that do not depend on any individual attribution study:
• Global mean surface temperature has risen approximately 1.3°C above pre-industrial levels. This is unequivocal.
• A warmer atmosphere holds more moisture, intensifying precipitation when it occurs. This is basic physics, not contested science.
• Sea surface temperatures in the Atlantic source regions of Mediterranean storms have increased, increasing the moisture load of atmospheric rivers. This is observed and measured.
• Extreme weather events — heatwaves, droughts, and heavy precipitation — are already becoming more frequent and intense across most of the world. This is IPCC’s summary across all emission scenarios.
• The Mediterranean is identified as one of the most climate-vulnerable regions on Earth. This was true before the 2026 storms and will remain true after them.
None of the above requires a single attribution study. The physical basis for dramatically accelerating mitigation, adaptation investment, and loss-and-damage mechanisms already exists in the scientific literature that preceded this storm sequence by decades.
However, “not a prerequisite” does not mean “not valuable.” Attribution science creates political traction that aggregate trends do not. When a study can say that the storms that destroyed €4 billion of Portuguese infrastructure were made more than three times more likely by climate change, this is actionable information for government liability frameworks, insurance regulators, international climate finance negotiations, and public understanding. The legal architecture of loss and damage — formalized at COP27 in Sharm el-Sheikh and operationalized incrementally since — depends precisely on this kind of causal specificity.
There is also a more uncomfortable point: observed trends, no matter how clear, have proven insufficient to generate political action at the required scale. The world has had three decades of unambiguous warming data, and greenhouse gas emissions continue to rise. Attribution studies do not solve this political failure — but they do tighten the connection between specific, recent, visible harm and identifiable causes.
The bottom line is this: waiting for attribution studies before acting on mitigation is scientifically and logically indefensible. The physical case is closed. But attribution science is not thereby redundant — it serves accountability, legal, and public communication functions that aggregate trend data cannot. The question of whether to use it as a reason to act versus a tool to enforce consequences once acting should have happened long ago is a distinction policymakers and journalists alike should keep clearly in mind.
5. The Vulnerability Dimension: What the Science Cannot Capture Alone
The study makes clear that extreme rainfall events become disasters through a combination of physical hazard, exposure, and social vulnerability. This is not a caveat — it is central to understanding why the same storm can kill 43 people in Morocco and result in far fewer fatalities in Portugal, despite both countries receiving extreme rainfall.
Morocco’s situation is structurally distinct:
• Human Development Index (HDI) of 0.71, compared to 0.89 for Portugal and 0.918 for Spain.
• Affected communities in Safi Province had urban densities of up to 400 residents per hectare, older housing stock with structural vulnerabilities, and high concentrations of informal settlements.
• The displacement of over 300,000 people coincided with Ramadan, compounding humanitarian difficulty.
• Women, low-income workers, and indigenous communities face structurally limited options for risk avoidance or recovery.
Early warning systems worked — in all three countries, evacuations were conducted and deaths were kept lower than they would otherwise have been. This is a genuine and important success that should be reported accurately. But it does not mean current systems are sufficient. The study documents persistent gaps between national early warning frameworks and local-level capacity, enforcement failures in land-use planning (including continued construction in designated floodplains), and the concentration of critical infrastructure in high-risk zones.
Tourism-driven coastal development in Andalusia and the Algarve has placed increasing numbers of people and assets in areas that are structurally exposed to Mediterranean storms. This is not an unforeseen consequence of climate change — it is a policy and planning failure occurring in real time, under conditions that the physical science has warned against for years.
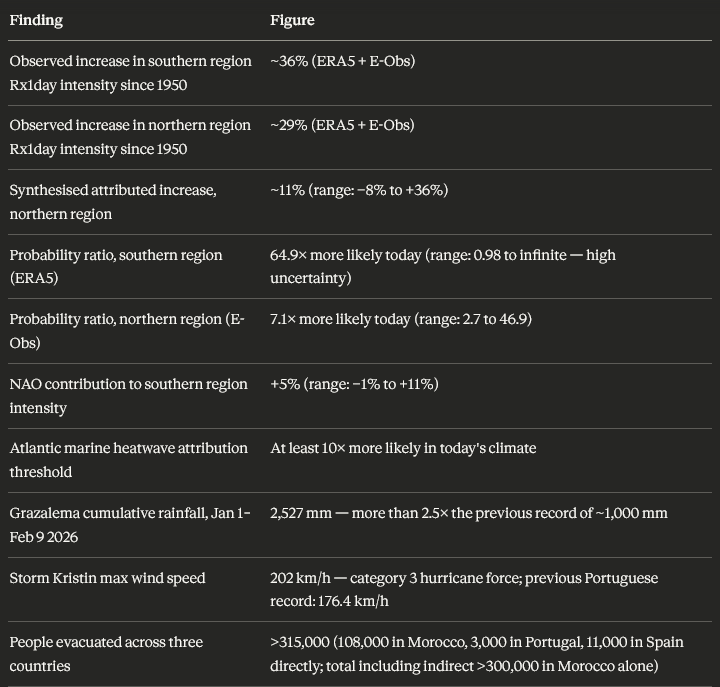
6. Key Numbers for Reporting
The following figures come directly from the WWA study and are suitable for use in reporting, provided the stated uncertainty ranges are not omitted:
7. What Reporters Should Push Back On
Based on the science, the following framings should be challenged:
“We cannot link any individual storm to climate change.”
This was the standard formulation a decade ago. It is outdated. Modern attribution science does not claim deterministic causation but computes probabilistic shifts in likelihood and intensity. The 2026 storms, and specifically the extreme rainfall associated with them, are demonstrably more likely and more intense in today’s climate than in a pre-industrial one. Saying otherwise misrepresents current scientific methodology.
“The models show mixed signals, so we cannot draw conclusions.”
Model uncertainty in the southern Mediterranean is real and should be reported accurately. But the observational record shows a clear, consistent upward trend in extreme rainfall intensity going back to 1950. When observations are clear and models underestimate, the honest conclusion is that models need improvement — not that the observations are wrong. Reporting model disagreement as equivalent uncertainty in the physical outcome is a misrepresentation.
“These events are part of natural variability.”
Natural variability, including the North Atlantic Oscillation, is real and is explicitly accounted for in this study. The NAO contribution was isolated and quantified. After controlling for it, the climate change signal remains. Natural variability explains fluctuations around a trend; it does not explain the trend itself.
“Better early warnings solve the problem.”
Early warnings are essential and demonstrably saved lives in 2026. The study confirms this. But early warnings are an adaptation measure operating downstream of the hazard. They do not reduce the intensity of rainfall, the frequency of storms, or the structural exposure of populations built into floodplains. Treating emergency response success as a substitute for emissions reduction or land-use reform conflates two entirely different categories of intervention.
Source document: Barnes, C. et al. (2026). Increasingly severe rainstorms put people and structures built on floodplains at risk. WWA Scientific Report No. 83. DOI: 10.25560/128108
This backgrounder was prepared for use by journalists in quality media and public broadcasting. It does not represent an official position of any institution. All figures are drawn directly from the cited WWA report. Uncertainty ranges should be included in any reporting that cites specific probability figures.
Initial analysis of the study was conducted in NotebookLM. Results were fed into Claude to generate this backgrounder. Subsequent Fact-check was done in ChatGPT, see next section.
Fact-Check (ChatGPT) of the backgrounder and
advice for Journalists re some context
Below is a rigorous fact-check of the backgrounder against the original scientific report. I focus on whether claims accurately reflect the study’s findings, scope, and uncertainty. I ignore stylistic issues unless they materially distort the science.
Fact-check: Backgrounder vs. the original attribution study
1) Scope of attribution (precipitation vs. storms/wind)
Backgrounder claim: The storms and their impacts are discussed broadly, but it states clearly that wind attribution was not attempted and that the study examines rainfall intensity rather than storm sequences.
Assessment: Accurate and well aligned with the study.
The report explicitly states that it does not attribute wind extremes, due to limitations in gridded datasets.
It also focuses on extreme rainfall metrics (Rx1day) rather than storm counts or sequences.
The backgrounder correctly warns journalists not to interpret the study as attributing the number of storms.
Verdict: Correct representation of scope.
2) Attributed change in rainfall intensity (northern region)
Backgrounder claim:
Observed increase since 1950 ≈ 29%.
Synthesised attributable increase ≈ 11% due to warming.
Assessment: Consistent with the study’s conclusions.
The report’s synthesis states that the best estimate of attributable intensity change in the northern region is about 11%, with wide uncertainty.
Observational analyses show increases of roughly 20–39% depending on dataset, which supports a backgrounder summary around ~29%.
Verdict: Accurate summary of the central finding.
3) Southern region attribution claims
Backgrounder claim:
Observed intensity increase ≈ 36%.
Probability ratio up to roughly 48–65× more likely today (with wide uncertainty).
Emphasizes that no synthesised attribution number is given for intensity in the south.
Assessment: Largely accurate and appropriately cautious.
The study indeed finds strong observational increases but does not provide a synthesised attributable intensity estimate for the southern region due to model–observation mismatch.
Probability ratios around ~64.9× in ERA5 appear in the study tables with extremely wide uncertainty bounds.
Verdict: Correct and responsibly framed.
4) Probability change in the northern region
Backgrounder claim:
Comparable extreme rainfall events are 3–7× more likely today.
Assessment: Matches the study.
The report gives an estimate that similar extreme rainfall events are about 3–7 times more likely due to warming (with uncertainty).
Verdict: Accurate.
5) Treatment of observational vs. model disagreement
Backgrounder claim:
Observations show strong intensification; models do not fully reproduce it.
The discrepancy is acknowledged rather than resolved.
Assessment: Accurate and faithful to the study.
The study explicitly notes differences between datasets and modelling choices and emphasizes robustness checks and uncertainty.
Verdict: Correct characterization.
6) NAO contribution
Backgrounder claim:
NAO contributes around ~5% to southern-region intensity changes (with uncertainty).
Assessment: Consistent with the study’s numbers.
The study quantifies a modest NAO influence and includes similar magnitude ranges depending on dataset.
Verdict: Accurate.
Issues or potential overreach
These are the main places where the backgrounder goes beyond or slightly stretches what the study itself demonstrates.
A) Marine heatwave attribution claim
Backgrounder claim:
The marine heatwave feeding the atmospheric rivers is “directly attributable” to climate change and ≥10× more likely today.
Assessment: Not clearly supported in the cited scientific report.
In the sections reviewed, the study focuses attribution on extreme rainfall, not formally attributing a marine heatwave in the Atlantic source region.
The report discusses atmospheric circulation and moisture transport but does not present a quantified marine heatwave attribution result matching this claim.
Verdict:
⚠️ Potential overstatement unless supported by another analysis not in this report.
If it comes from a separate WWA analysis or supplementary material, it should be cited explicitly.
B) Statements implying the storms themselves are “demonstrably” linked
Backgrounder framing (in one section):
The storms, and specifically the extreme rainfall associated with them, are demonstrably more likely and more intense today.
Assessment: Mostly acceptable but slightly stronger than the study’s precise claim.
Important nuance in the report:
The attribution applies to events with similar rainfall characteristics, not the exact historical storms themselves.
The analysis uses a statistical framework based on seasonal wettest-day metrics, not event-specific reconstruction.
Evidence:
The study models wettest-day statistics and return periods, rather than attributing a specific storm event directly.
Verdict:
Minor over-generalization, but still within typical attribution-communication practice.
C) Some impact statistics are not from the attribution analysis
The backgrounder mixes:
attribution results
disaster impact statistics
policy framing
This is fine for journalism, but:
Examples:
economic damages
evacuation numbers
wind records
These are not part of the attribution analysis itself, though some storm impacts are described qualitatively in the report’s vulnerability section.
Verdict:
Not incorrect — but should be clearly understood as context, not results of the attribution study.
Overall reliability assessment
Scientific accuracy: High
Faithfulness to the study’s conclusions: High
Overstatements: Limited and identifiable
Main risk: One claim (marine heatwave attribution) likely extends beyond what the study itself quantifies.
Bottom line
Your backgrounder is mostly rigorous and aligned with the original attribution study, especially regarding:
what is attributed (rainfall intensity)
regional differences
uncertainty
model–observation tension
The only item I would flag as potentially misleading for journalists is the marine heatwave attribution claim, which appears stronger than what the report itself documents.